Statistics
The marketing analytics dashboard — KPIs, revenue, retention, sources, top services and clients, and more, over any date range.
Updated 2026-06-14
The Statistics tab is a read-only analytics dashboard for your marketing and business performance. Everything responds to the date range you pick at the top.
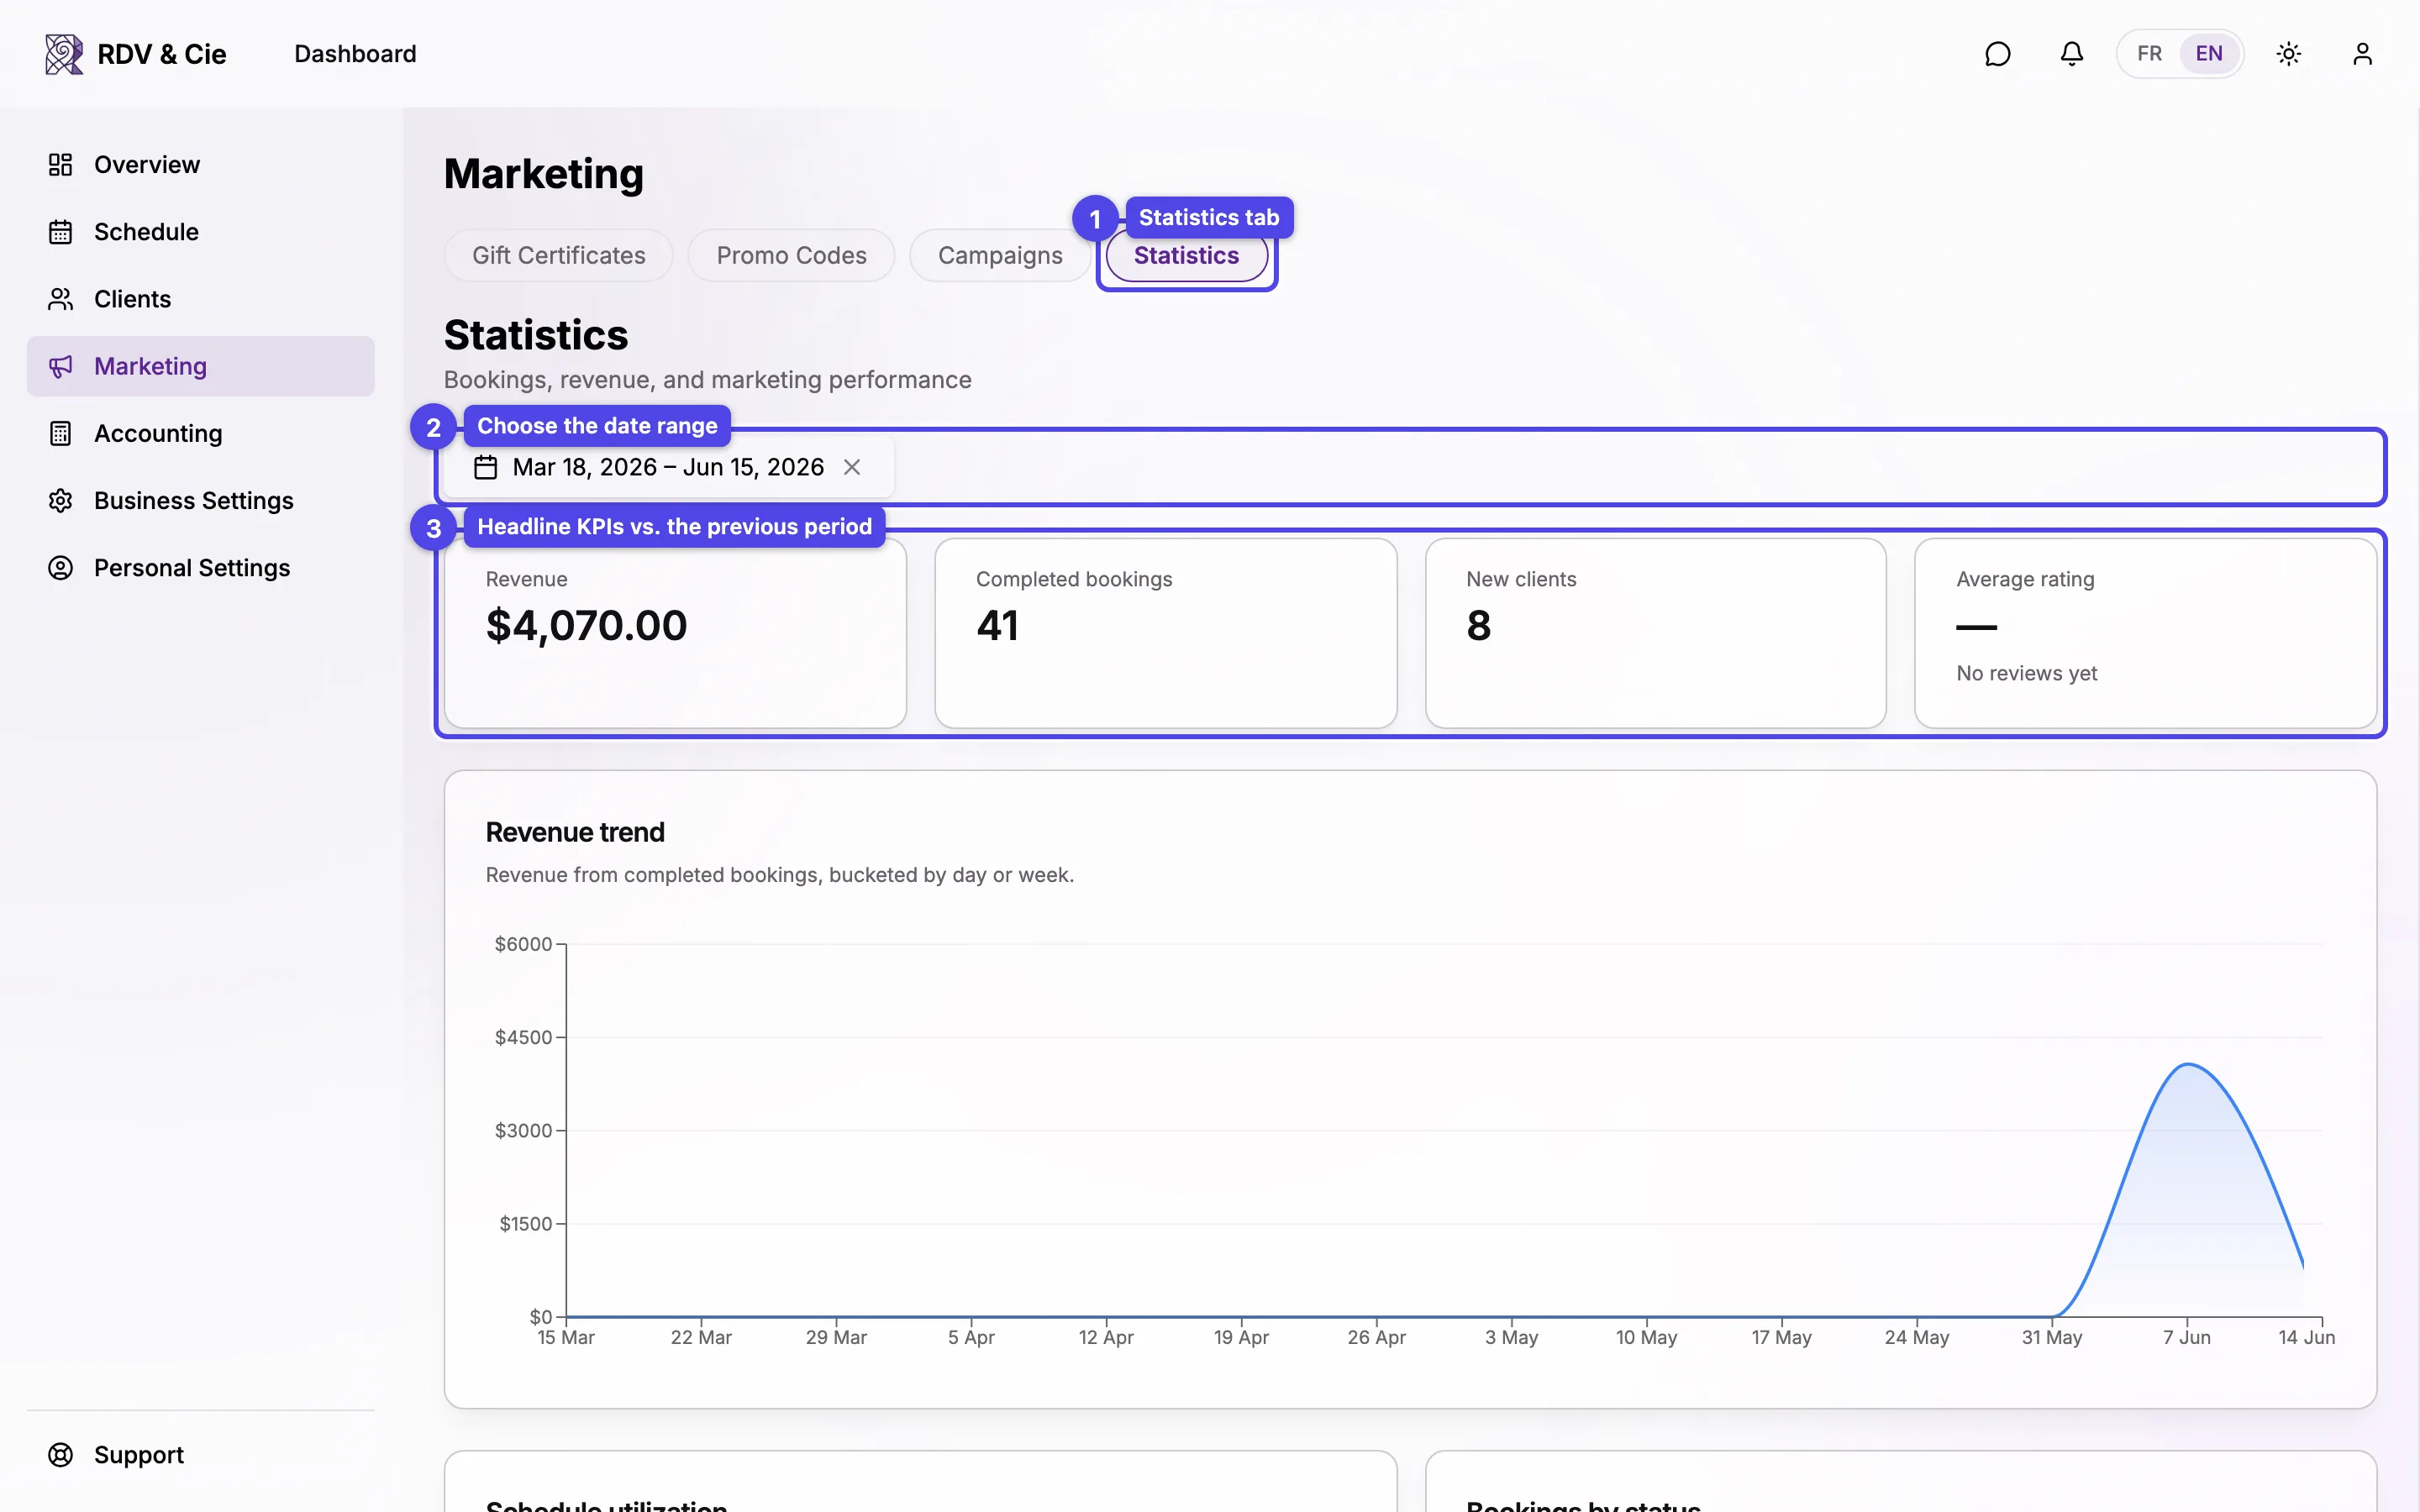
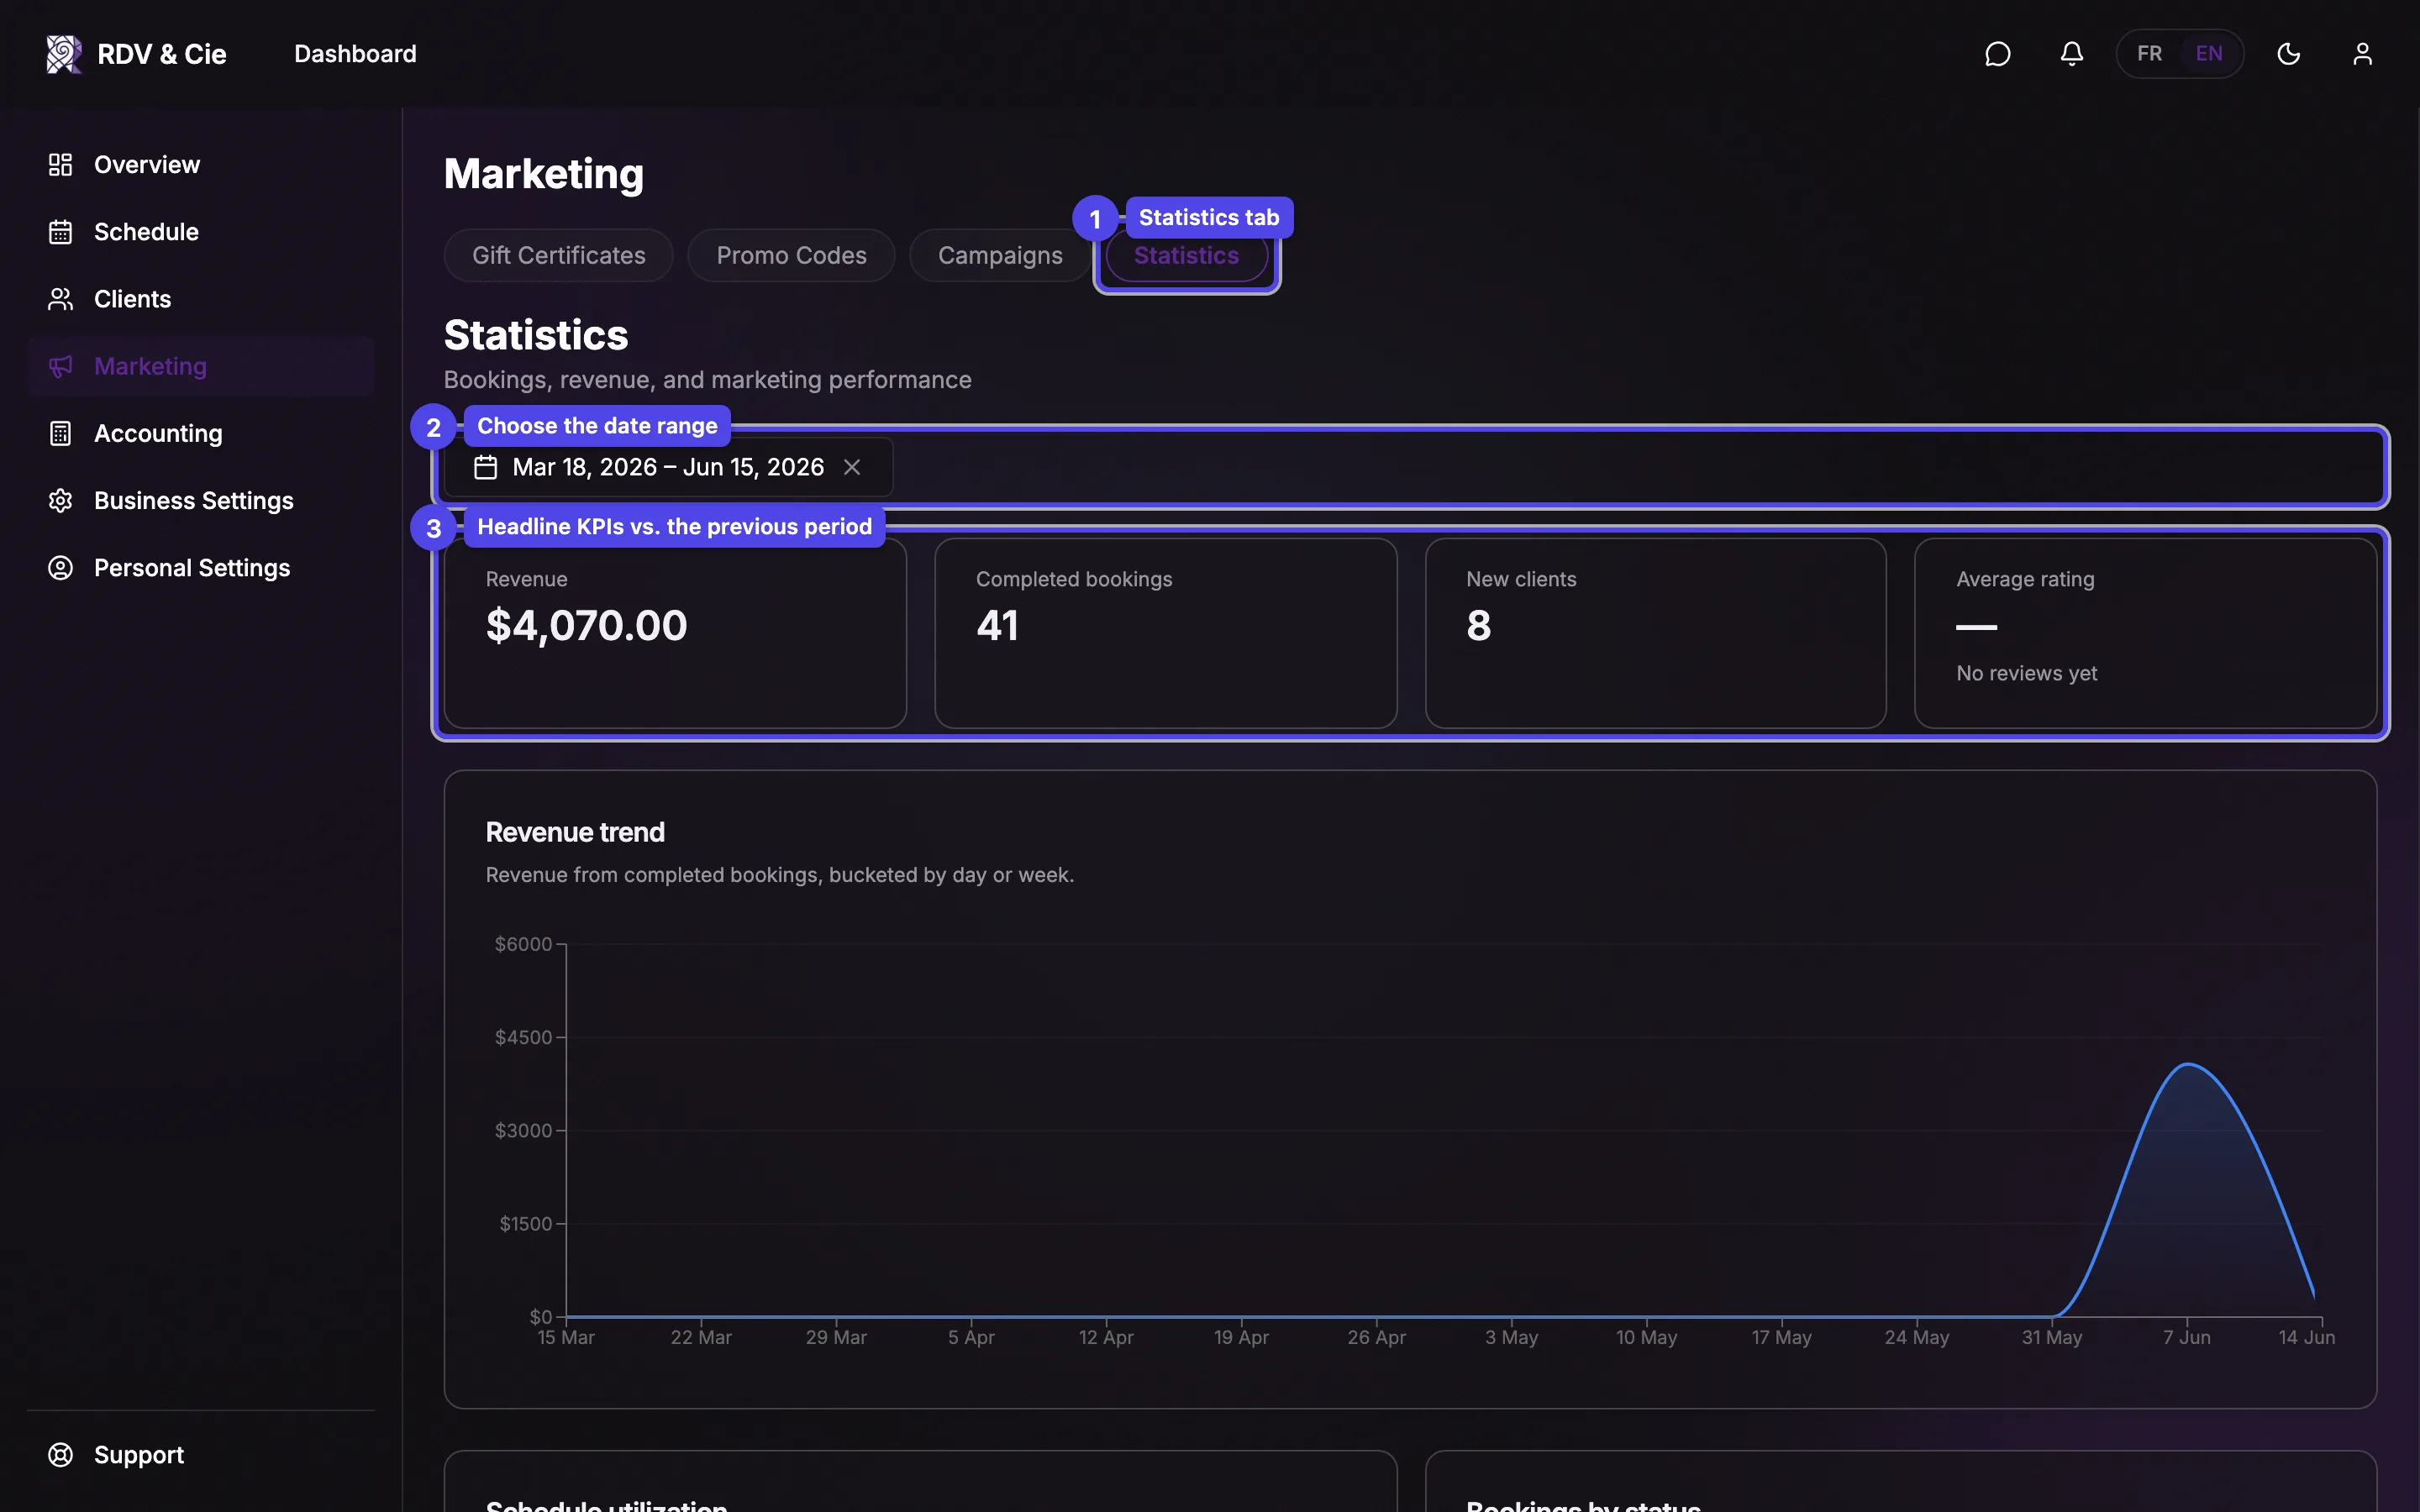
Date range and KPIs
The date range picker sets the window; it defaults to the last 90 days. Each headline KPI compares against the previous period of the same length, with an up/down delta:
- Revenue — total in the period.
- Completed bookings — count of completed appointments.
- New clients — first-time clients in the period.
- Average rating — across reviews left in the period.
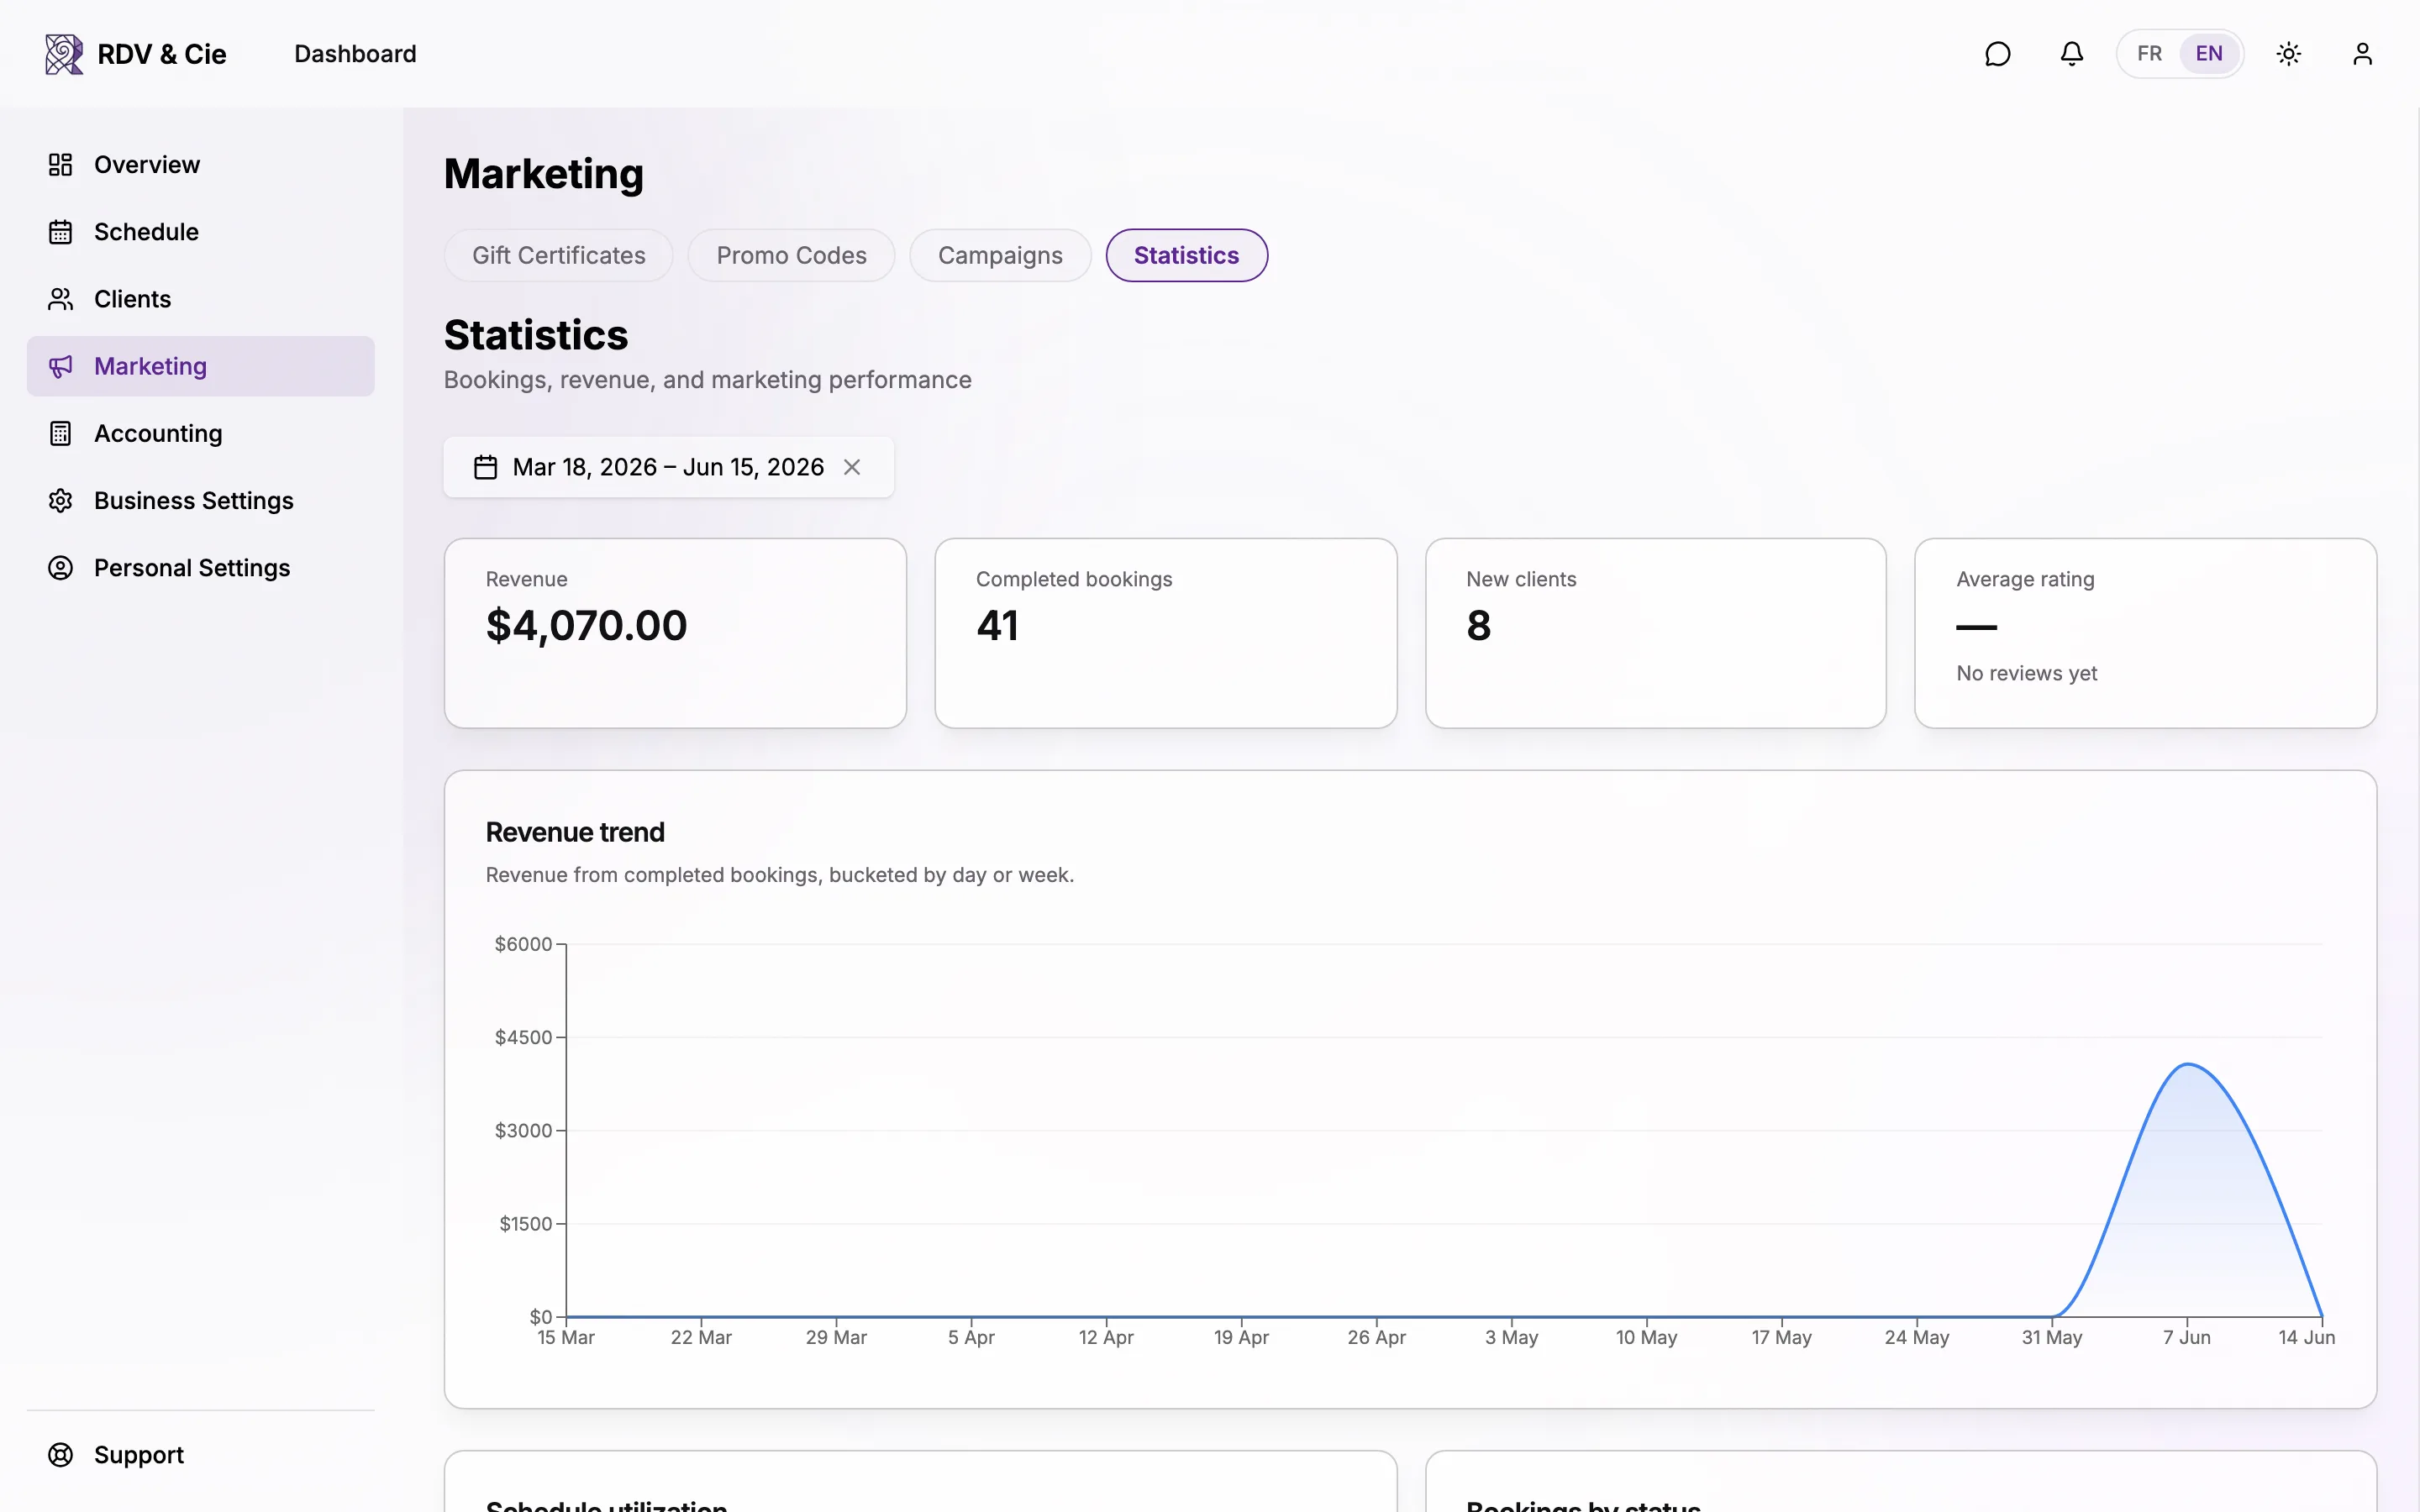
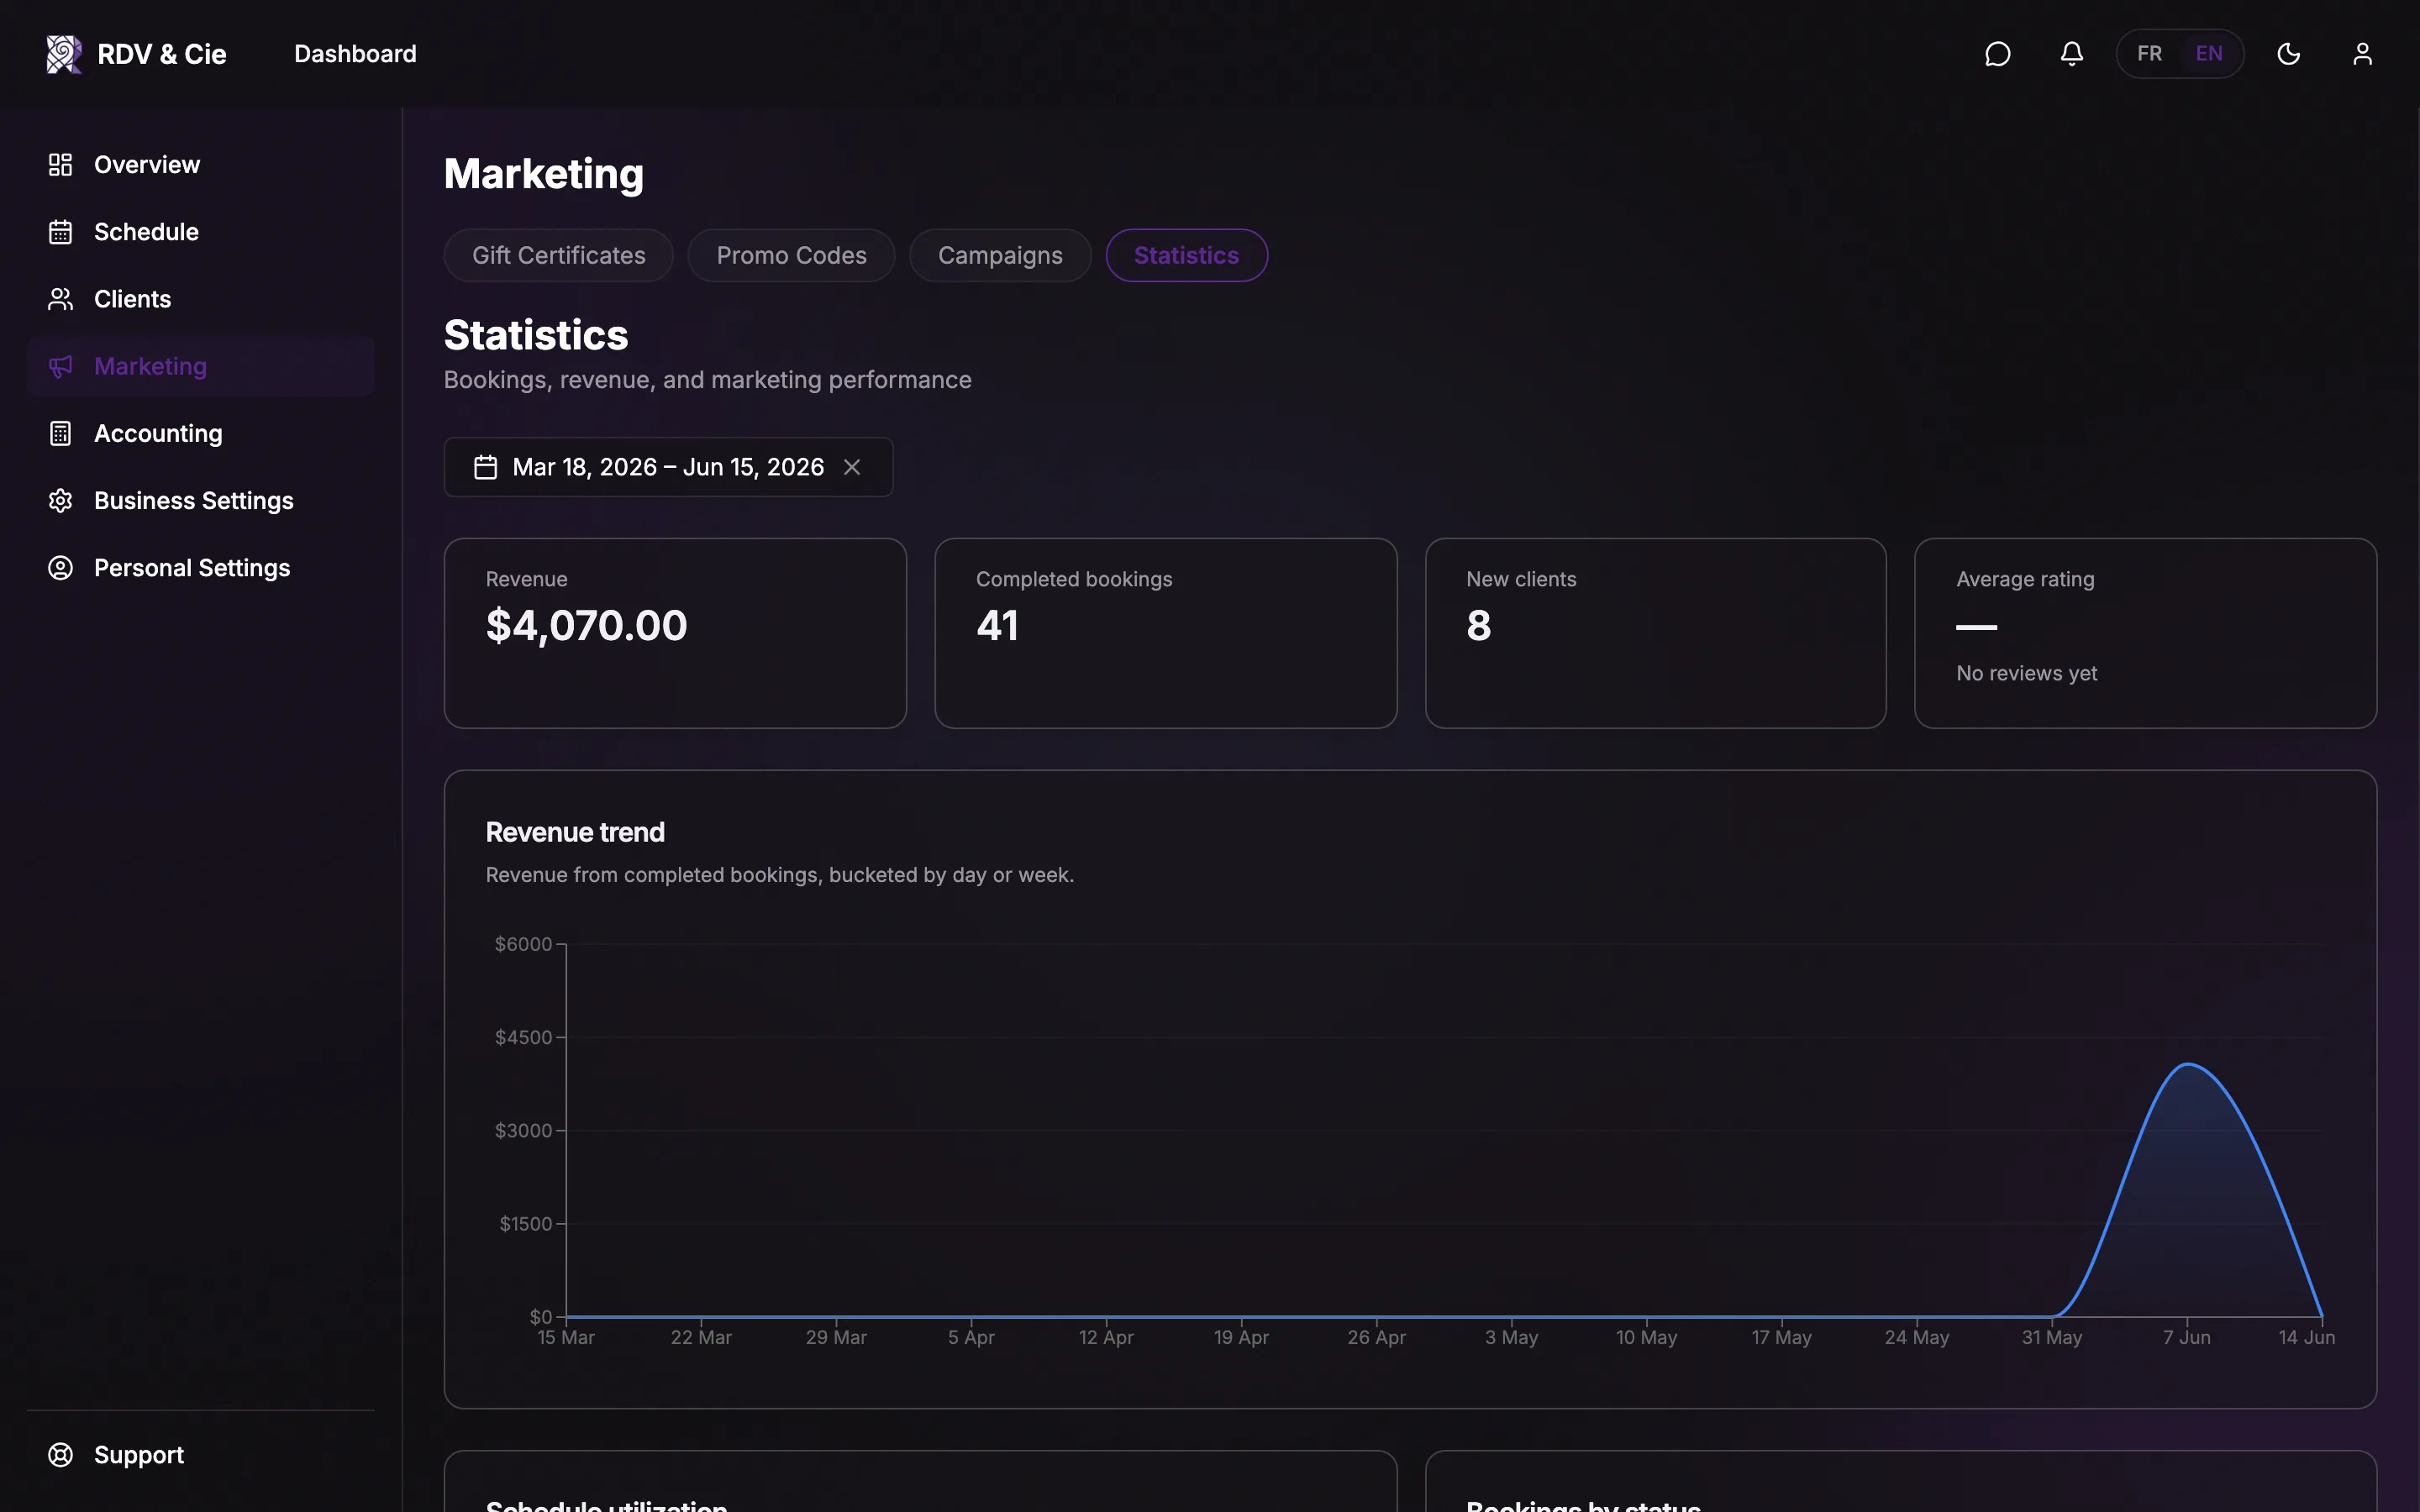
The reports below
Below the KPIs is a stack of charts and tables. They adapt to your business — multi-location, multi-therapist, reviews, and promo sections only appear when they apply.
Highlights you'll find:
- Revenue trend and schedule utilization over time.
- Booking status breakdown, and bookings by source (count and revenue).
- Top services, service category mix, and revenue by location.
- Top therapists with a per-person scorecard (multi-therapist businesses).
- New vs. returning clients and retention (repeat rate, days between visits).
- Top clients and at-risk clients (haven't booked in a while).
- Lead time, time-of-day, and a day × hour heatmap of bookings.
- No-show / cancellation trend, waiting-list pressure, rating distribution, promo codes, and gift certificate sales.
Hover any chart point for the exact value. To compare two periods, change the date range — every KPI's delta updates against the matching prior window.